Basic Stats
| Portfolio Value | $ 806,899,528 |
| Current Positions | 70 |
Latest Holdings, Performance, AUM (from 13F, 13D)
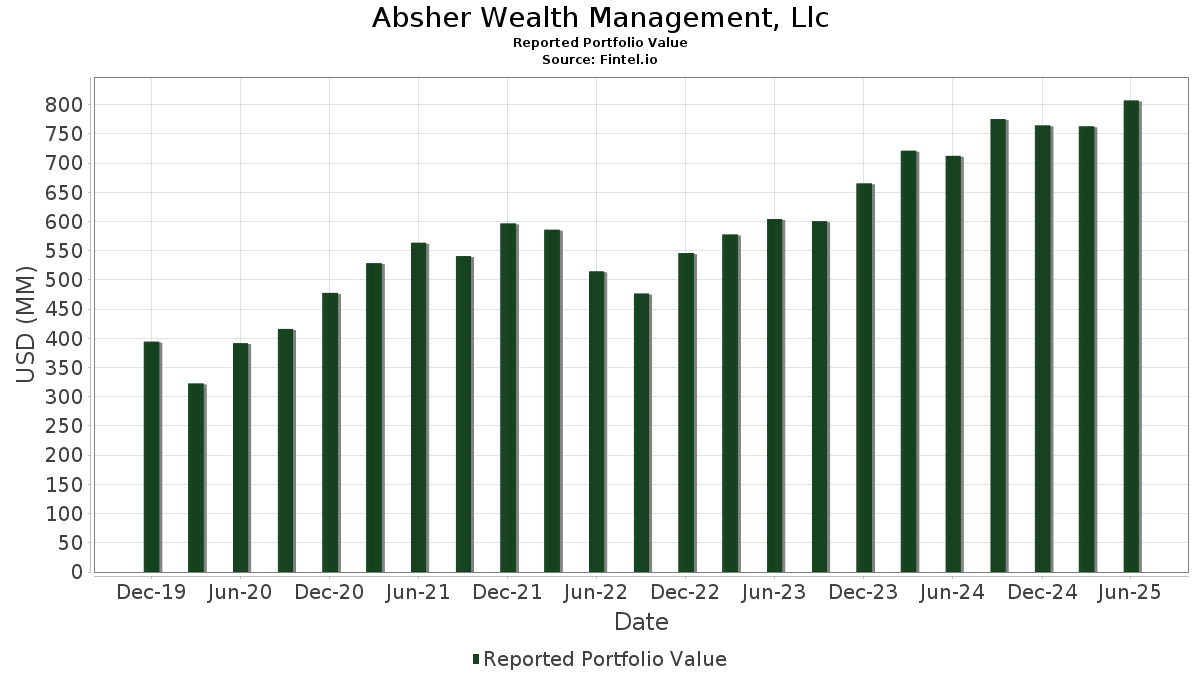
Absher Wealth Management, Llc has disclosed 70 total holdings in their latest SEC filings. Most recent portfolio value is calculated to be $ 806,899,528 USD. Actual Assets Under Management (AUM) is this value plus cash (which is not disclosed). Absher Wealth Management, Llc’s top holdings are M&T Bank Corporation (US:MTB) , Microsoft Corporation (US:MSFT) , Lincoln Electric Holdings, Inc. (US:LECO) , Emerson Electric Co. (US:EMR) , and Analog Devices, Inc. (US:ADI) . Absher Wealth Management, Llc’s new positions include Taiwan Semiconductor Manufacturing Company Limited - Depositary Receipt (Common Stock) (US:TSM) , Liberty Media, Bond 4%, Due 11/15/2029 (US:US530715AG61) , Vanguard Index Funds - Vanguard Growth ETF (US:VUG) , .
Top Increases This Quarter
We use the change in the portfolio allocation because this is the most meaningful metric. Changes can be due to trades or changes in share prices.
| Security | Shares (MM) |
Value (MM$) |
Portfolio % | ΔPortfolio % |
|---|---|---|---|---|
| 0.48 | 34.21 | 4.2397 | 0.7465 | |
| 0.28 | 37.98 | 4.7068 | 0.5821 | |
| 0.25 | 48.03 | 5.9520 | 0.5340 | |
| 0.08 | 39.16 | 4.8526 | 0.5269 | |
| 0.16 | 37.12 | 4.6003 | 0.5216 | |
| 0.10 | 20.51 | 2.5413 | 0.3776 | |
| 0.19 | 38.58 | 4.7807 | 0.2304 | |
| 0.11 | 32.24 | 3.9949 | 0.2042 | |
| 0.10 | 26.45 | 3.2779 | 0.1949 | |
| 0.13 | 22.08 | 2.7367 | 0.1762 |
Top Decreases This Quarter
We use the change in the portfolio allocation because this is the most meaningful metric. Changes can be due to trades or changes in share prices.
| Security | Shares (MM) |
Value (MM$) |
Portfolio % | ΔPortfolio % |
|---|---|---|---|---|
| 0.72 | 19.47 | 2.4125 | -0.7401 | |
| 0.22 | 33.38 | 4.1369 | -0.5514 | |
| 0.06 | 17.10 | 2.1197 | -0.5093 | |
| 0.04 | 21.43 | 2.6564 | -0.4660 | |
| 0.25 | 32.86 | 4.0718 | -0.4595 | |
| 0.08 | 21.53 | 2.6684 | -0.4269 | |
| 0.09 | 18.58 | 2.3021 | -0.3957 | |
| 0.06 | 30.49 | 3.7787 | -0.2789 | |
| 0.13 | 18.83 | 2.3331 | -0.2296 | |
| 0.09 | 31.51 | 3.9057 | -0.1940 |
13F and Fund Filings
This form was filed on 2025-07-23 for the reporting period 2025-06-30. Click the link icon to see the full transaction history.
Upgrade to unlock premium data and export to Excel ![]() .
.
| Security | Type | Avg Share Price | Shares (MM) |
ΔShares (%) |
ΔShares (%) |
Value ($MM) |
Portfolio (%) |
ΔPortfolio (%) |
|
|---|---|---|---|---|---|---|---|---|---|
| MTB / M&T Bank Corporation | 0.25 | 7.11 | 48.03 | 16.24 | 5.9520 | 0.5340 | |||
| MSFT / Microsoft Corporation | 0.08 | -10.42 | 39.16 | 18.70 | 4.8526 | 0.5269 | |||
| LECO / Lincoln Electric Holdings, Inc. | 0.19 | 1.43 | 38.58 | 11.17 | 4.7807 | 0.2304 | |||
| EMR / Emerson Electric Co. | 0.28 | -0.71 | 37.98 | 20.74 | 4.7068 | 0.5821 | |||
| ADI / Analog Devices, Inc. | 0.16 | 1.12 | 37.12 | 19.34 | 4.6003 | 0.5216 | |||
| NKE / NIKE, Inc. | 0.48 | 14.75 | 34.21 | 28.42 | 4.2397 | 0.7465 | |||
| JNJ / Johnson & Johnson | 0.22 | 1.37 | 33.38 | -6.63 | 4.1369 | -0.5514 | |||
| PEP / PepsiCo, Inc. | 0.25 | 7.97 | 32.86 | -4.92 | 4.0718 | -0.4595 | |||
| JPM / JPMorgan Chase & Co. | 0.11 | -5.65 | 32.24 | 11.51 | 3.9949 | 0.2042 | |||
| V / Visa Inc. | 0.09 | -0.50 | 31.51 | 0.80 | 3.9057 | -0.1940 | |||
| DE / Deere & Company | 0.06 | -9.05 | 30.49 | -1.46 | 3.7787 | -0.2789 | |||
| SNA / Snap-on Incorporated | 0.09 | 20.26 | 28.52 | 11.04 | 3.5342 | 0.1664 | |||
| FAST / Fastenal Company | 0.67 | 98.24 | 28.13 | 7.36 | 3.4863 | 0.0504 | |||
| SBUX / Starbucks Corporation | 0.30 | 13.26 | 27.51 | 5.80 | 3.4088 | -0.0002 | |||
| CVX / Chevron Corporation | 0.19 | 22.41 | 27.49 | 4.78 | 3.4069 | -0.0337 | |||
| WMT / Walmart Inc. | 0.28 | -1.26 | 26.92 | 9.97 | 3.3358 | 0.1262 | |||
| RL / Ralph Lauren Corporation | 0.10 | -9.46 | 26.45 | 12.50 | 3.2779 | 0.1949 | |||
| COST / Costco Wholesale Corporation | 0.02 | -1.05 | 24.41 | 3.57 | 3.0256 | -0.0653 | |||
| GOOGL / Alphabet Inc. | 0.13 | -0.76 | 22.08 | 13.10 | 2.7367 | 0.1762 | |||
| AMGN / Amgen Inc. | 0.08 | 1.78 | 21.53 | -8.78 | 2.6684 | -0.4269 | |||
| BRK.A / Berkshire Hathaway Inc. | 0.04 | -1.31 | 21.43 | -9.98 | 2.6564 | -0.4660 | |||
| ABT / Abbott Laboratories | 0.16 | -1.16 | 21.23 | 1.34 | 2.6313 | -0.1161 | |||
| BA / The Boeing Company | 0.10 | 1.15 | 20.51 | 24.27 | 2.5413 | 0.3776 | |||
| BFB / Brown-Forman Corp. - Class B | 0.72 | 2.12 | 19.47 | -19.03 | 2.4125 | -0.7401 | |||
| PAYX / Paychex, Inc. | 0.13 | 2.17 | 18.83 | -3.67 | 2.3331 | -0.2296 | |||
| AAPL / Apple Inc. | 0.09 | -2.25 | 18.58 | -9.71 | 2.3021 | -0.3957 | |||
| MCD / McDonald's Corporation | 0.06 | -8.79 | 17.10 | -14.68 | 2.1197 | -0.5093 | |||
| HSY / The Hershey Company | 0.02 | 2.91 | 3.52 | -0.14 | 0.4362 | -0.0260 | |||
| LULU / lululemon athletica inc. | 0.01 | 37.81 | 2.62 | 15.64 | 0.3244 | 0.0276 | |||
| META / Meta Platforms, Inc. | 0.00 | 0.35 | 2.55 | 28.50 | 0.3163 | 0.0559 | |||
| CMI / Cummins Inc. | 0.01 | 20.17 | 2.32 | 25.61 | 0.2875 | 0.0452 | |||
| LOW / Lowe's Companies, Inc. | 0.01 | -1.32 | 2.20 | -6.10 | 0.2728 | -0.0347 | |||
| DG / Dollar General Corporation | 0.02 | -31.43 | 2.18 | -10.82 | 0.2708 | -0.0504 | |||
| ADBE / Adobe Inc. | 0.01 | 3.39 | 2.15 | 4.32 | 0.2663 | -0.0039 | |||
| WMS / Advanced Drainage Systems, Inc. | 0.02 | 4.95 | 1.98 | 10.97 | 0.2458 | 0.0114 | |||
| DIS / The Walt Disney Company | 0.01 | 0.11 | 1.79 | 25.83 | 0.2216 | 0.0352 | |||
| SHEL / Shell plc - Depositary Receipt (Common Stock) | 0.03 | 3.12 | 1.79 | -0.89 | 0.2215 | -0.0151 | |||
| AME / AMETEK, Inc. | 0.01 | 0.01 | 1.51 | 5.09 | 0.1870 | -0.0012 | |||
| GOOGL / Alphabet Inc. | 0.01 | -6.19 | 1.24 | 6.60 | 0.1542 | 0.0010 | |||
| TPR / Tapestry, Inc. | 0.01 | -0.05 | 1.13 | 24.62 | 0.1406 | 0.0212 | |||
| MA / Mastercard Incorporated | 0.00 | -14.00 | 1.12 | -11.84 | 0.1394 | -0.0279 | |||
| PAYC / Paycom Software, Inc. | 0.00 | 5.95 | 0.93 | 12.17 | 0.1155 | 0.0066 | |||
| MCY / Mercury General Corporation | 0.01 | -21.39 | 0.90 | -5.25 | 0.1119 | -0.0131 | |||
| PM / Philip Morris International Inc. | 0.00 | -3.49 | 0.83 | 10.65 | 0.1031 | 0.0046 | |||
| TXN / Texas Instruments Incorporated | 0.00 | 3.61 | 0.77 | 19.81 | 0.0959 | 0.0111 | |||
| NXPI / NXP Semiconductors N.V. | 0.00 | 0.41 | 0.75 | 15.43 | 0.0927 | 0.0077 | |||
| MRK / Merck & Co., Inc. | 0.01 | 5.27 | 0.74 | -7.15 | 0.0917 | -0.0128 | |||
| WAT / Waters Corporation | 0.00 | -2.12 | 0.71 | -7.31 | 0.0880 | -0.0125 | |||
| AMZN / Amazon.com, Inc. | 0.00 | 1.60 | 0.68 | 17.18 | 0.0846 | 0.0082 | |||
| UPS / United Parcel Service, Inc. | 0.01 | 5.27 | 0.61 | -3.35 | 0.0750 | -0.0071 | |||
| DEO / Diageo plc - Depositary Receipt (Common Stock) | 0.01 | -0.42 | 0.60 | -4.15 | 0.0745 | -0.0078 | |||
| HD / The Home Depot, Inc. | 0.00 | -1.66 | 0.59 | -1.68 | 0.0728 | -0.0055 | |||
| WSM / Williams-Sonoma, Inc. | 0.00 | 3.85 | 0.57 | 7.32 | 0.0710 | 0.0010 | |||
| NVDD / Direxion Shares ETF Trust - Direxion Daily NVDA Bear 1X Shares | 0.00 | -50.41 | 0.50 | -27.67 | 0.0622 | -0.0289 | |||
| ORCL / Oracle Corporation | 0.00 | 0.00 | 0.49 | 56.33 | 0.0613 | 0.0198 | |||
| DUK / Duke Energy Corporation | 0.00 | -2.12 | 0.44 | -5.23 | 0.0539 | -0.0063 | |||
| TROW / T. Rowe Price Group, Inc. | 0.00 | -5.49 | 0.41 | -0.72 | 0.0512 | -0.0034 | |||
| AZO / AutoZone, Inc. | 0.00 | 0.00 | 0.37 | -2.62 | 0.0460 | -0.0040 | |||
| LMT / Lockheed Martin Corporation | 0.00 | 7.05 | 0.32 | 10.88 | 0.0392 | 0.0018 | |||
| UL / Unilever PLC - Depositary Receipt (Common Stock) | 0.00 | -4.96 | 0.30 | -2.26 | 0.0376 | -0.0032 | |||
| PFE / Pfizer Inc. | 0.01 | 0.63 | 0.29 | -3.68 | 0.0357 | -0.0035 | |||
| VTI / Vanguard Index Funds - Vanguard Total Stock Market ETF | 0.00 | 0.00 | 0.28 | 10.40 | 0.0343 | 0.0015 | |||
| AVGO / Broadcom Inc. | 0.00 | 0.26 | 0.0328 | 0.0328 | |||||
| HON / Honeywell International Inc. | 0.00 | -45.33 | 0.25 | -39.81 | 0.0308 | -0.0234 | |||
| TSM / Taiwan Semiconductor Manufacturing Company Limited - Depositary Receipt (Common Stock) | 0.00 | 0.24 | 0.0292 | 0.0292 | |||||
| UI / Ubiquiti Inc. | 0.00 | 0.21 | 0.0259 | 0.0259 | |||||
| VO / Vanguard Index Funds - Vanguard Mid-Cap ETF | 0.00 | 0.00 | 0.00 | 0.00 | 0.0006 | 0.0000 | |||
| US530715AG61 / Liberty Media, Bond 4%, Due 11/15/2029 | 0.00 | -60.00 | 0.0003 | -0.0005 | |||||
| VB / Vanguard Index Funds - Vanguard Small-Cap ETF | 0.00 | 0.00 | 0.00 | 0.00 | 0.0002 | 0.0000 | |||
| VUG / Vanguard Index Funds - Vanguard Growth ETF | 0.00 | 0.00 | 0.0002 | 0.0002 | |||||
| VNQ / Vanguard Specialized Funds - Vanguard Real Estate ETF | 0.00 | -100.00 | 0.00 | 0.0000 | |||||
| XOM / Exxon Mobil Corporation | 0.00 | -100.00 | 0.00 | 0.0000 |