Basic Stats
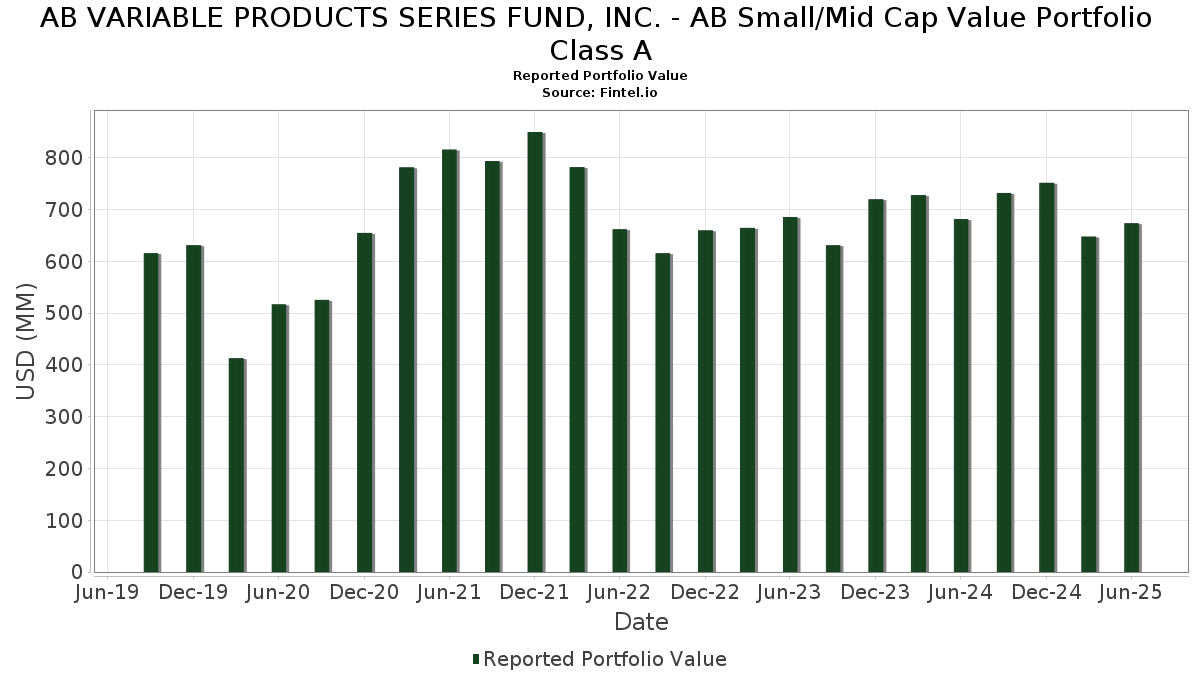
| Portfolio Value | $ 673,620,055 |
| Current Positions | 92 |
Latest Holdings, Performance, AUM (from 13F, 13D)
AB VARIABLE PRODUCTS SERIES FUND, INC. - AB Small/Mid Cap Value Portfolio Class A has disclosed 92 total holdings in their latest SEC filings. Most recent portfolio value is calculated to be $ 673,620,055 USD. Actual Assets Under Management (AUM) is this value plus cash (which is not disclosed). AB VARIABLE PRODUCTS SERIES FUND, INC. - AB Small/Mid Cap Value Portfolio Class A’s top holdings are BJ's Wholesale Club Holdings, Inc. (US:BJ) , Encompass Health Corporation (US:EHC) , TXNM Energy, Inc. (US:TXNM) , Jones Lang LaSalle Incorporated (US:JLL) , and The Hanover Insurance Group, Inc. (US:THG) . AB VARIABLE PRODUCTS SERIES FUND, INC. - AB Small/Mid Cap Value Portfolio Class A’s new positions include Tenet Healthcare Corporation (US:THC) , RPM International Inc. (US:RPM) , CACI International Inc (US:CACI) , Integer Holdings Corporation (US:ITGR) , and UMB Financial Corporation (US:UMBF) .
Top Increases This Quarter
We use the change in the portfolio allocation because this is the most meaningful metric. Changes can be due to trades or changes in share prices.
| Security | Shares (MM) |
Value (MM$) |
Portfolio % | ΔPortfolio % |
|---|---|---|---|---|
| 0.06 | 10.28 | 1.5311 | 1.5311 | |
| 0.09 | 9.57 | 1.4252 | 1.4252 | |
| 0.02 | 9.46 | 1.4088 | 1.4088 | |
| 0.07 | 9.05 | 1.3476 | 1.3476 | |
| 0.08 | 8.68 | 1.2937 | 1.2937 | |
| 0.10 | 6.84 | 1.0189 | 1.0189 | |
| 0.13 | 6.80 | 1.0134 | 1.0134 | |
| 0.07 | 6.78 | 1.0094 | 1.0094 | |
| 0.25 | 6.63 | 0.9882 | 0.9882 | |
| 0.09 | 8.97 | 1.3363 | 0.9325 |
Top Decreases This Quarter
We use the change in the portfolio allocation because this is the most meaningful metric. Changes can be due to trades or changes in share prices.
| Security | Shares (MM) |
Value (MM$) |
Portfolio % | ΔPortfolio % |
|---|---|---|---|---|
| 0.05 | 2.19 | 0.3259 | -0.9108 | |
| 0.08 | 7.67 | 1.1422 | -0.6182 | |
| 0.06 | 4.48 | 0.6680 | -0.6055 | |
| 0.24 | 5.64 | 0.8409 | -0.4463 | |
| 0.03 | 4.76 | 0.7091 | -0.4178 | |
| 0.02 | 6.72 | 1.0009 | -0.4074 | |
| 0.02 | 6.92 | 1.0314 | -0.3605 | |
| 0.25 | 4.31 | 0.6424 | -0.3487 | |
| 0.29 | 6.02 | 0.8960 | -0.3458 | |
| 0.09 | 5.40 | 0.8039 | -0.3382 |
13F and Fund Filings
This form was filed on 2025-08-26 for the reporting period 2025-06-30. Click the link icon to see the full transaction history.
Upgrade to unlock premium data and export to Excel ![]() .
.
| Security | Type | Avg Share Price | Shares (MM) |
ΔShares (%) |
ΔShares (%) |
Value ($MM) |
Portfolio (%) |
ΔPortfolio (%) |
|
|---|---|---|---|---|---|---|---|---|---|
| BJ / BJ's Wholesale Club Holdings, Inc. | 0.12 | 0.00 | 13.18 | -5.50 | 1.9629 | -0.1884 | |||
| EHC / Encompass Health Corporation | 0.10 | -8.97 | 12.08 | 10.22 | 1.7989 | 0.1084 | |||
| TXNM / TXNM Energy, Inc. | 0.21 | -11.27 | 11.71 | -6.56 | 1.7451 | -0.1893 | |||
| JLL / Jones Lang LaSalle Incorporated | 0.04 | 7.83 | 11.19 | 11.25 | 1.6677 | 0.1152 | |||
| THG / The Hanover Insurance Group, Inc. | 0.06 | 0.00 | 10.50 | -2.34 | 1.5641 | -0.0948 | |||
| NXST / Nexstar Media Group, Inc. | 0.06 | 34.56 | 10.48 | 29.84 | 1.5608 | 0.3159 | |||
| IDA / IDACORP, Inc. | 0.09 | -3.14 | 10.35 | -3.78 | 1.5415 | -0.1178 | |||
| THC / Tenet Healthcare Corporation | 0.06 | 10.28 | 1.5311 | 1.5311 | |||||
| PNR / Pentair plc | 0.10 | -8.14 | 10.09 | 7.80 | 1.5027 | 0.0589 | |||
| RPM / RPM International Inc. | 0.09 | 9.57 | 1.4252 | 1.4252 | |||||
| BBWI / Bath & Body Works, Inc. | 0.32 | 7.59 | 9.50 | 6.31 | 1.4158 | 0.0365 | |||
| RRX / Regal Rexnord Corporation | 0.07 | 0.00 | 9.48 | 27.32 | 1.4116 | 0.2633 | |||
| CACI / CACI International Inc | 0.02 | 9.46 | 1.4088 | 1.4088 | |||||
| IVZ / Invesco Ltd. | 0.60 | 0.00 | 9.44 | 3.96 | 1.4069 | 0.0051 | |||
| NATL / NCR Atleos Corporation | 0.33 | 0.00 | 9.28 | 8.15 | 1.3830 | 0.0585 | |||
| CBOE / Cboe Global Markets, Inc. | 0.04 | -11.76 | 9.24 | -9.05 | 1.3759 | -0.1911 | |||
| GXO / GXO Logistics, Inc. | 0.19 | 10.36 | 9.13 | 37.53 | 1.3599 | 0.3357 | |||
| ITGR / Integer Holdings Corporation | 0.07 | 9.05 | 1.3476 | 1.3476 | |||||
| CROX / Crocs, Inc. | 0.09 | 0.00 | 8.98 | -4.63 | 1.3376 | -0.1151 | |||
| DLTR / Dollar Tree, Inc. | 0.09 | 159.83 | 8.97 | 242.89 | 1.3363 | 0.9325 | |||
| ADT / ADT Inc. | 1.06 | -3.67 | 8.96 | 0.24 | 1.3340 | -0.0445 | |||
| AFG / American Financial Group, Inc. | 0.07 | 0.00 | 8.91 | -3.90 | 1.3276 | -0.1034 | |||
| CDP / COPT Defense Properties | 0.32 | 7.21 | 8.91 | 8.43 | 1.3275 | 0.0595 | |||
| NOMD / Nomad Foods Limited | 0.52 | 0.00 | 8.80 | -13.54 | 1.3108 | -0.2594 | |||
| UMBF / UMB Financial Corporation | 0.08 | 8.68 | 1.2937 | 1.2937 | |||||
| GPK / Graphic Packaging Holding Company | 0.41 | 6.62 | 8.61 | -13.46 | 1.2833 | -0.2526 | |||
| BWA / BorgWarner Inc. | 0.26 | -19.42 | 8.61 | -5.83 | 1.2825 | -0.1281 | |||
| AHR / American Healthcare REIT, Inc. | 0.23 | 20.98 | 8.49 | 46.69 | 1.2646 | 0.3717 | |||
| FCNCA / First Citizens BancShares, Inc. | 0.00 | -14.39 | 8.41 | -9.67 | 1.2532 | -0.1837 | |||
| IRT / Independence Realty Trust, Inc. | 0.48 | 0.00 | 8.40 | -16.68 | 1.2519 | -0.3042 | |||
| JBTM / JBT Marel Corporation | 0.07 | 9.61 | 8.28 | 7.87 | 1.2338 | 0.0492 | |||
| IJF / ICON Public Limited Company | 0.06 | 21.97 | 8.13 | 1.39 | 1.2104 | -0.0262 | |||
| NVST / Envista Holdings Corporation | 0.42 | 35.41 | 8.11 | 53.32 | 1.2085 | 0.3920 | |||
| SNX / TD SYNNEX Corporation | 0.06 | -22.24 | 8.05 | 1.49 | 1.1994 | -0.0246 | |||
| CNM / Core & Main, Inc. | 0.13 | -23.54 | 8.02 | -4.49 | 1.1948 | -0.1008 | |||
| AN / AutoNation, Inc. | 0.04 | -26.35 | 7.89 | -9.65 | 1.1760 | -0.1720 | |||
| WTFC / Wintrust Financial Corporation | 0.06 | -8.12 | 7.82 | 1.30 | 1.1652 | -0.0263 | |||
| FLR / Fluor Corporation | 0.15 | -20.18 | 7.73 | 14.24 | 1.1508 | 0.1075 | |||
| CHRW / C.H. Robinson Worldwide, Inc. | 0.08 | -28.28 | 7.67 | -32.80 | 1.1422 | -0.6182 | |||
| SF / Stifel Financial Corp. | 0.07 | -4.53 | 7.52 | 5.11 | 1.1205 | 0.0163 | |||
| MTDR / Matador Resources Company | 0.16 | 0.00 | 7.51 | -6.59 | 1.1189 | -0.1218 | |||
| ARCB / ArcBest Corporation | 0.10 | -4.61 | 7.51 | 4.08 | 1.1184 | 0.0054 | |||
| US0186167484 / AB Fixed Income Shares, Inc. - Government Money Market Portfolio | 7.46 | 24.27 | 7.46 | 24.29 | 1.1114 | 0.1851 | |||
| KEX / Kirby Corporation | 0.07 | -45.40 | 7.43 | 1.91 | 1.1074 | -0.0790 | |||
| WDFC / WD-40 Company | 0.03 | 19.55 | 7.37 | 11.76 | 1.0971 | 0.0803 | |||
| CNH / CNH Industrial N.V. | 0.57 | 0.00 | 7.33 | 5.54 | 1.0920 | 0.0203 | |||
| STAG / STAG Industrial, Inc. | 0.20 | 0.00 | 7.28 | 0.44 | 1.0850 | -0.0338 | |||
| HRI / Herc Holdings Inc. | 0.05 | 38.74 | 7.22 | 36.09 | 1.0751 | 0.2568 | |||
| LITE / Lumentum Holdings Inc. | 0.08 | -40.30 | 7.14 | -8.96 | 1.0635 | -0.1465 | |||
| GPI / Group 1 Automotive, Inc. | 0.02 | -32.87 | 6.92 | -23.25 | 1.0314 | -0.3605 | |||
| OGS / ONE Gas, Inc. | 0.10 | 6.84 | 1.0189 | 1.0189 | |||||
| AVNT / Avient Corporation | 0.21 | 0.00 | 6.84 | -13.05 | 1.0185 | -0.1948 | |||
| ON / ON Semiconductor Corporation | 0.13 | 6.80 | 1.0134 | 1.0134 | |||||
| BC / Brunswick Corporation | 0.12 | 26.02 | 6.79 | 29.29 | 1.0119 | 0.2012 | |||
| GLOB / Globant S.A. | 0.07 | 6.78 | 1.0094 | 1.0094 | |||||
| IPGP / IPG Photonics Corporation | 0.10 | 0.00 | 6.77 | 8.72 | 1.0083 | 0.0478 | |||
| MGY / Magnolia Oil & Gas Corporation | 0.30 | -7.30 | 6.76 | -17.50 | 1.0063 | -0.2570 | |||
| FFIV / F5, Inc. | 0.02 | -33.40 | 6.72 | -26.38 | 1.0009 | -0.4074 | |||
| WSC / WillScot Holdings Corporation | 0.24 | -4.56 | 6.70 | -5.94 | 0.9978 | -0.1009 | |||
| HASI / HA Sustainable Infrastructure Capital, Inc. | 0.25 | 6.63 | 0.9882 | 0.9882 | |||||
| ACIW / ACI Worldwide, Inc. | 0.14 | 10.04 | 6.59 | -7.66 | 0.9822 | -0.1195 | |||
| INDB / Independent Bank Corp. | 0.10 | 69.19 | 6.58 | 69.85 | 0.9803 | 0.3824 | |||
| CXT / Crane NXT, Co. | 0.12 | 29.32 | 6.46 | 25.44 | 0.9623 | 0.1483 | |||
| NICE / NICE Ltd. - Depositary Receipt (Common Stock) | 0.04 | -10.03 | 6.33 | -1.43 | 0.9431 | -0.0479 | |||
| FHB / First Hawaiian, Inc. | 0.25 | -18.13 | 6.16 | -16.38 | 0.9178 | -0.2191 | |||
| AVT / Avnet, Inc. | 0.12 | -7.32 | 6.16 | 2.29 | 0.9177 | -0.0115 | |||
| OI / O-I Glass, Inc. | 0.42 | 6.16 | 0.9176 | 0.9176 | |||||
| HXL / Hexcel Corporation | 0.11 | 6.13 | 0.9130 | 0.9130 | |||||
| MLKN / MillerKnoll, Inc. | 0.31 | -5.64 | 6.03 | -4.26 | 0.8983 | -0.0735 | |||
| FBP / First BanCorp. | 0.29 | -31.22 | 6.02 | -25.26 | 0.8960 | -0.3458 | |||
| FA / First Advantage Corporation | 0.36 | 5.96 | 0.8885 | 0.8885 | |||||
| NOG / Northern Oil and Gas, Inc. | 0.20 | 0.00 | 5.77 | -6.22 | 0.8597 | -0.0898 | |||
| CRTO / Criteo S.A. - Depositary Receipt (Common Stock) | 0.24 | 0.00 | 5.64 | -32.34 | 0.8409 | -0.4463 | |||
| TCBI / Texas Capital Bancshares, Inc. | 0.07 | -19.51 | 5.56 | -14.44 | 0.8280 | -0.1744 | |||
| WBS / Webster Financial Corporation | 0.10 | -23.93 | 5.52 | -19.43 | 0.8226 | -0.2349 | |||
| CMA / Comerica Incorporated | 0.09 | -27.81 | 5.40 | -27.10 | 0.8039 | -0.3382 | |||
| BDC / Belden Inc. | 0.04 | 0.00 | 5.09 | 15.52 | 0.7586 | 0.0784 | |||
| FORM / FormFactor, Inc. | 0.15 | -28.22 | 5.07 | -12.69 | 0.7554 | -0.1407 | |||
| FR / First Industrial Realty Trust, Inc. | 0.10 | -12.95 | 4.86 | -22.37 | 0.7245 | -0.2420 | |||
| WD / Walker & Dunlop, Inc. | 0.07 | 0.00 | 4.85 | -17.44 | 0.7228 | -0.1839 | |||
| RHP / Ryman Hospitality Properties, Inc. | 0.05 | -6.30 | 4.85 | 1.11 | 0.7220 | -0.0176 | |||
| MTZ / MasTec, Inc. | 0.03 | -55.37 | 4.76 | -34.82 | 0.7091 | -0.4178 | |||
| CALX / Calix, Inc. | 0.09 | -47.06 | 4.70 | -20.56 | 0.7007 | -0.2127 | |||
| CCJ / Cameco Corporation | 0.06 | -69.87 | 4.48 | -45.67 | 0.6680 | -0.6055 | |||
| CVLT / Commvault Systems, Inc. | 0.03 | 4.36 | 4.41 | 15.32 | 0.6571 | 0.0669 | |||
| SBLK / Star Bulk Carriers Corp. | 0.25 | -18.15 | 4.31 | -40.85 | 0.6424 | -0.3487 | |||
| CBRL / Cracker Barrel Old Country Store, Inc. | 0.07 | 4.07 | 0.6065 | 0.6065 | |||||
| BNL / Broadstone Net Lease, Inc. | 0.25 | 0.00 | 3.93 | -5.80 | 0.5859 | -0.0584 | |||
| FLG / Flagstar Financial, Inc. | 0.37 | 3.93 | 0.5848 | 0.5848 | |||||
| CUBE / CubeSmart | 0.09 | -7.68 | 3.92 | -8.13 | 0.5838 | -0.0744 | |||
| DINO / HF Sinclair Corporation | 0.07 | 0.00 | 2.94 | 24.90 | 0.4387 | 0.0750 | |||
| RHI / Robert Half Inc. | 0.05 | -63.73 | 2.19 | -72.71 | 0.3259 | -0.9108 |