Basic Stats
| Portfolio Value | $ 1,798,985,288 |
| Current Positions | 70 |
Latest Holdings, Performance, AUM (from 13F, 13D)
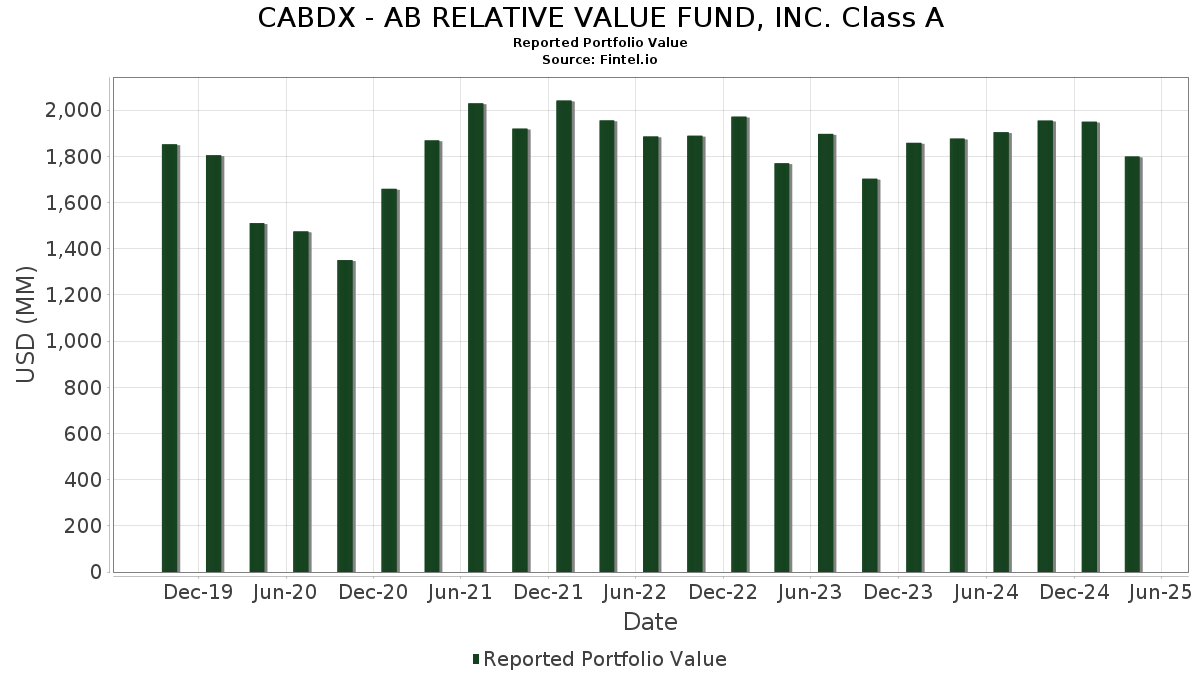
CABDX - AB RELATIVE VALUE FUND, INC. Class A has disclosed 70 total holdings in their latest SEC filings. Most recent portfolio value is calculated to be $ 1,798,985,288 USD. Actual Assets Under Management (AUM) is this value plus cash (which is not disclosed). CABDX - AB RELATIVE VALUE FUND, INC. Class A’s top holdings are Berkshire Hathaway Inc. (US:BRK.A) , Philip Morris International Inc. (US:PM) , Johnson & Johnson (US:JNJ) , JPMorgan Chase & Co. (US:JPM) , and Walmart Inc. (US:WMT) . CABDX - AB RELATIVE VALUE FUND, INC. Class A’s new positions include CSX Corporation (GB:0HRJ) , Otis Worldwide Corporation (US:OTIS) , NICE Ltd. - Depositary Receipt (Common Stock) (US:NICE) , Mondelez International, Inc. (US:MDLZ) , and AT&T Inc. (US:T) .
Top Increases This Quarter
We use the change in the portfolio allocation because this is the most meaningful metric. Changes can be due to trades or changes in share prices.
| Security | Shares (MM) |
Value (MM$) |
Portfolio % | ΔPortfolio % |
|---|---|---|---|---|
| 60.07 | 60.07 | 3.3868 | 2.1411 | |
| 0.46 | 72.00 | 4.0596 | 1.1481 | |
| 0.11 | 47.01 | 2.6506 | 1.1013 | |
| 0.62 | 17.42 | 0.9820 | 0.9820 | |
| 0.17 | 16.51 | 0.9311 | 0.9311 | |
| 0.07 | 27.14 | 1.5300 | 0.8433 | |
| 0.09 | 13.27 | 0.7483 | 0.7483 | |
| 0.19 | 13.24 | 0.7466 | 0.7466 | |
| 0.92 | 31.54 | 1.7780 | 0.7158 | |
| 0.13 | 23.56 | 1.3283 | 0.6671 |
Top Decreases This Quarter
We use the change in the portfolio allocation because this is the most meaningful metric. Changes can be due to trades or changes in share prices.
| Security | Shares (MM) |
Value (MM$) |
Portfolio % | ΔPortfolio % |
|---|---|---|---|---|
| 26.68 | 26.68 | 1.5045 | -1.8823 | |
| 0.42 | 28.75 | 1.6208 | -1.5474 | |
| 0.05 | 12.61 | 0.7107 | -0.8134 | |
| 0.20 | 5.69 | 0.3208 | -0.7392 | |
| 0.00 | 0.00 | -0.6859 | ||
| 0.26 | 63.95 | 3.6057 | -0.6839 | |
| 0.00 | 0.00 | -0.6683 | ||
| 0.25 | 17.87 | 1.0073 | -0.6204 | |
| 0.05 | 16.37 | 0.9231 | -0.5569 | |
| 0.23 | 12.40 | 0.6989 | -0.5362 |
13F and Fund Filings
This form was filed on 2025-06-26 for the reporting period 2025-04-30. Click the link icon to see the full transaction history.
Upgrade to unlock premium data and export to Excel ![]() .
.
| Security | Type | Avg Share Price | Shares (MM) |
ΔShares (%) |
ΔShares (%) |
Value ($MM) |
Portfolio (%) |
ΔPortfolio (%) |
|
|---|---|---|---|---|---|---|---|---|---|
| BRK.A / Berkshire Hathaway Inc. | 0.15 | -11.46 | 79.41 | 0.74 | 4.4770 | 0.4174 | |||
| PM / Philip Morris International Inc. | 0.45 | -23.57 | 77.41 | 0.59 | 4.3646 | 0.4008 | |||
| JNJ / Johnson & Johnson | 0.46 | 23.98 | 72.00 | 27.37 | 4.0596 | 1.1481 | |||
| JPM / JPMorgan Chase & Co. | 0.26 | -16.10 | 63.95 | -23.21 | 3.6057 | -0.6839 | |||
| WMT / Walmart Inc. | 0.66 | -17.03 | 63.81 | -17.80 | 3.5974 | -0.4005 | |||
| FI / Fiserv, Inc. | 0.33 | 16.64 | 61.16 | -0.35 | 3.4485 | 0.2872 | |||
| US0186167484 / AB Fixed Income Shares, Inc. - Government Money Market Portfolio | 60.07 | 148.36 | 60.07 | 148.36 | 3.3868 | 2.1411 | |||
| RTX / RTX Corporation | 0.40 | 7.19 | 50.13 | 4.85 | 2.8263 | 0.3639 | |||
| ACN / Accenture plc | 0.16 | 3.44 | 49.35 | -19.62 | 2.7822 | -0.3796 | |||
| ELV / Elevance Health, Inc. | 0.11 | 47.04 | 47.01 | 56.28 | 2.6506 | 1.1013 | |||
| SPGI / S&P Global Inc. | 0.09 | -5.74 | 45.86 | -9.60 | 2.5856 | -0.0271 | |||
| GILD / Gilead Sciences, Inc. | 0.42 | -11.97 | 44.43 | -3.51 | 2.5049 | 0.1333 | |||
| EOG / EOG Resources, Inc. | 0.34 | 3.23 | 37.56 | -9.46 | 2.1179 | -0.0188 | |||
| REGN / Regeneron Pharmaceuticals, Inc. | 0.06 | -17.71 | 35.96 | -26.78 | 2.0273 | -0.5020 | |||
| TXN / Texas Instruments Incorporated | 0.22 | 0.00 | 34.87 | -13.30 | 1.9657 | -0.1055 | |||
| AXS / AXIS Capital Holdings Limited | 0.36 | -8.74 | 34.82 | -3.43 | 1.9629 | 0.1062 | |||
| COR / Cencora, Inc. | 0.12 | -21.30 | 34.15 | -9.39 | 1.9255 | -0.0158 | |||
| CMCSA / Comcast Corporation | 0.92 | 50.49 | 31.54 | 52.91 | 1.7780 | 0.7158 | |||
| DGX / Quest Diagnostics Incorporated | 0.17 | 17.97 | 30.71 | 28.91 | 1.7313 | 0.5044 | |||
| WFC / Wells Fargo & Company | 0.43 | -8.90 | 30.67 | -17.91 | 1.7291 | -0.1950 | |||
| EA / Electronic Arts Inc. | 0.20 | -24.06 | 28.77 | -10.36 | 1.6219 | -0.0310 | |||
| C / Citigroup Inc. | 0.42 | -44.35 | 28.75 | -53.27 | 1.6208 | -1.5474 | |||
| ULTA / Ulta Beauty, Inc. | 0.07 | 112.03 | 27.14 | 103.54 | 1.5300 | 0.8433 | |||
| US0186167484 / AB Fixed Income Shares, Inc. - Government Money Market Portfolio | 26.68 | -55.58 | 26.68 | -55.58 | 1.5045 | -1.8823 | |||
| VLTO / Veralto Corporation | 0.27 | 0.19 | 25.79 | -7.06 | 1.4542 | 0.0248 | |||
| JBHT / J.B. Hunt Transport Services, Inc. | 0.19 | 7.60 | 25.14 | -17.94 | 1.4172 | -0.1605 | |||
| CASY / Casey's General Stores, Inc. | 0.05 | -9.80 | 25.03 | -1.07 | 1.4109 | 0.1080 | |||
| PSX / Phillips 66 | 0.23 | -6.74 | 24.12 | -17.67 | 1.3601 | -0.1489 | |||
| DKS / DICK'S Sporting Goods, Inc. | 0.13 | 134.64 | 23.56 | 83.52 | 1.3283 | 0.6671 | |||
| MET / MetLife, Inc. | 0.31 | 97.06 | 23.50 | 71.68 | 1.3252 | 0.6201 | |||
| TSM / Taiwan Semiconductor Manufacturing Company Limited - Depositary Receipt (Common Stock) | 0.14 | 0.27 | 23.31 | -20.15 | 1.3143 | -0.1893 | |||
| GNRC / Generac Holdings Inc. | 0.20 | 15.92 | 22.91 | -11.21 | 1.2916 | -0.0373 | |||
| CVX / Chevron Corporation | 0.16 | -11.36 | 22.19 | -19.16 | 1.2509 | -0.1626 | |||
| RHHBY / Roche Holding AG - Depositary Receipt (Common Stock) | 0.54 | -7.89 | 22.01 | -4.33 | 1.2412 | 0.0561 | |||
| WAB / Westinghouse Air Brake Technologies Corporation | 0.12 | 0.03 | 21.99 | -11.12 | 1.2399 | -0.0344 | |||
| STLD / Steel Dynamics, Inc. | 0.15 | 0.43 | 20.09 | 1.61 | 1.1327 | 0.1144 | |||
| CF / CF Industries Holdings, Inc. | 0.25 | 22.63 | 19.63 | 4.22 | 1.1065 | 0.1367 | |||
| HCA / HCA Healthcare, Inc. | 0.06 | 57.33 | 19.62 | 64.57 | 1.1064 | 0.4922 | |||
| SBUX / Starbucks Corporation | 0.24 | 0.33 | 19.48 | -25.42 | 1.0985 | -0.2470 | |||
| COP / ConocoPhillips | 0.22 | 21.75 | 19.37 | 9.79 | 1.0918 | 0.1834 | |||
| MA / Mastercard Incorporated | 0.03 | 0.47 | 18.68 | -0.86 | 1.0534 | 0.0828 | |||
| PSA / Public Storage | 0.06 | 16.44 | 18.42 | 17.20 | 1.0387 | 0.2291 | |||
| GEHC / GE HealthCare Technologies Inc. | 0.25 | -29.02 | 17.87 | -43.47 | 1.0073 | -0.6204 | |||
| ROST / Ross Stores, Inc. | 0.13 | -31.77 | 17.76 | -37.01 | 1.0016 | -0.4508 | |||
| 0HRJ / CSX Corporation | 0.62 | 17.42 | 0.9820 | 0.9820 | |||||
| OTIS / Otis Worldwide Corporation | 0.17 | 16.51 | 0.9311 | 0.9311 | |||||
| UTHR / United Therapeutics Corporation | 0.05 | -33.99 | 16.37 | -43.02 | 0.9231 | -0.5569 | |||
| PCAR / PACCAR Inc | 0.16 | 39.33 | 14.80 | 13.36 | 0.8345 | 0.1620 | |||
| PPG / PPG Industries, Inc. | 0.13 | 50.46 | 13.63 | 41.97 | 0.7682 | 0.2739 | |||
| NICE / NICE Ltd. - Depositary Receipt (Common Stock) | 0.09 | 13.27 | 0.7483 | 0.7483 | |||||
| MDLZ / Mondelez International, Inc. | 0.19 | 13.24 | 0.7466 | 0.7466 | |||||
| LULU / lululemon athletica inc. | 0.05 | -34.84 | 12.61 | -57.40 | 0.7107 | -0.8134 | |||
| NVT / nVent Electric plc | 0.23 | -38.73 | 12.40 | -48.31 | 0.6989 | -0.5362 | |||
| LOW / Lowe's Companies, Inc. | 0.06 | 77.84 | 12.36 | 74.38 | 0.6970 | 0.3194 | |||
| NKE / NIKE, Inc. | 0.20 | -30.07 | 11.56 | -48.71 | 0.6515 | -0.5090 | |||
| BXSL / Blackstone Secured Lending Fund | 0.39 | -12.61 | 11.55 | -23.72 | 0.6510 | -0.1287 | |||
| FCN / FTI Consulting, Inc. | 0.06 | 1.21 | 10.14 | -13.85 | 0.5716 | -0.0345 | |||
| ALLE / Allegion plc | 0.07 | -18.38 | 10.14 | -14.41 | 0.5715 | -0.0384 | |||
| MSM / MSC Industrial Direct Co., Inc. | 0.12 | 0.92 | 9.36 | -4.02 | 0.5278 | 0.0255 | |||
| T / AT&T Inc. | 0.32 | 9.00 | 0.5072 | 0.5072 | |||||
| ALSN / Allison Transmission Holdings, Inc. | 0.10 | 42.74 | 8.91 | 12.03 | 0.5021 | 0.0926 | |||
| MTG / MGIC Investment Corporation | 0.35 | -30.99 | 8.70 | -32.69 | 0.4904 | -0.1752 | |||
| LRCX / Lam Research Corporation | 0.12 | -31.63 | 8.41 | -39.55 | 0.4739 | -0.2422 | |||
| CW / Curtiss-Wright Corporation | 0.02 | -46.46 | 8.36 | -46.78 | 0.4714 | -0.3377 | |||
| INTC / Intel Corporation | 0.37 | -54.58 | 7.47 | -53.01 | 0.4210 | -0.3974 | |||
| BWA / BorgWarner Inc. | 0.20 | -68.93 | 5.69 | -72.35 | 0.3208 | -0.7392 | |||
| CSL / Carlisle Companies Incorporated | 0.01 | 5.57 | 0.3141 | 0.3141 | |||||
| HP / Helmerich & Payne, Inc. | 0.29 | 35.04 | 5.56 | -19.26 | 0.3135 | -0.0412 | |||
| WHD / Cactus, Inc. | 0.13 | 38.95 | 5.08 | -16.48 | 0.2863 | -0.0226 | |||
| A / Agilent Technologies, Inc. | 0.04 | 4.23 | 0.2386 | 0.2386 | |||||
| RHI / Robert Half Inc. | 0.00 | -100.00 | 0.00 | -100.00 | -0.6683 | ||||
| DHI / D.R. Horton, Inc. | 0.00 | -100.00 | 0.00 | -100.00 | -0.6859 |